

Doprava zdarma se Zásilkovnou nad 1 499 Kč
PPL Parcel Shop 54 Kč
Balík do ruky 74 Kč
Balíkovna 49 Kč
GLS 54 Kč
Kurýr GLS 74 Kč
Zásilkovna 49 Kč
PPL 99 Kč
 Jak nakupovat
Pomoc
Doručení
PPL Parcel Shop 54 Kč
Balík do ruky 74 Kč
Balíkovna 49 Kč
GLS 54 Kč
Kurýr GLS 74 Kč
Zásilkovna 49 Kč
PPL 99 Kč
Doprava zdarma se Zásilkovnou nad 1 499 Kč
Nákupní rádce
Jsme tu pro vás!
571 999 090
Můj účet
Staňte se součástí komunity milovníků knih z celého světa a získejte hromadu výhod.
Založit účet zdarma
▸
Prázdný :-(
0
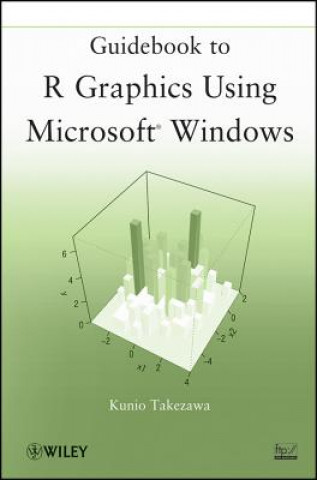
Guidebook to R Graphics Using Microsoft Windowsow
Jazyk
 Angličtina
Angličtina
Kniha
Brožovaná
This book introduces the graphical capabilities of R to readers new to the software, taking readers...
Celý popis
Libristo kód: 04469997
?
 242 b
242 b
242 b
2 416
Kč
včetně DPH
Skladem u dodavatele v malém množství
Odesíláme za 11-15 dnů
30 dní na vrácení zboží
Mohlo by vás také zajímat
 /
Pevná
/
Pevná
 3 968
Kč
3 968
Kč


 /
Brožovaná
3 996
Kč
/
Brožovaná
3 996
Kč

This book introduces the graphical capabilities of R to readers new to the software, taking readers step by step through the process of creating histograms, boxplots, strip charts, time series graphs, steam-and-leaf displays, scatterplot matrices, and map graphs. Throughout the book, concise explanations of key concepts of R graphics assist readers in carrying out the presented procedures. The discussed techniques are accompanied by a wealth of screenshots and graphics with related R code available on the book's FTP site, and numerous exercises allow readers to test their understanding of the presented material.
Informace o knize
Plný název
Guidebook to R Graphics Using Microsoft Windowsow
Autor
Kunio Takezawa
Jazyk
Angličtina
Angličtina
Vazba
Kniha - Brožovaná
Datum vydání
2012
Počet stran
278
EAN
9781118026397
ISBN
111802639X
Libristo kód
04469997
Nakladatelství
John Wiley & Sons Inc
Váha
390
Rozměry
157 x 234 x 14
